Introducing the New Custom Report Builder in Aplos
Save time by creating custom financial and donor reports in Aplos, and showcase your data using sleek charts and graphs. Display your data how you want on a report that fits your organization’s needs, and save it as a new report so you can come back to it without having to recreate your customizations. Then schedule automatic emails of your saved reports to the people who need to see them, such as your board or staff.
With the new Custom Report Builder, you can:
- Easily move and hide columns on your reports
- Add additional filters to your reports
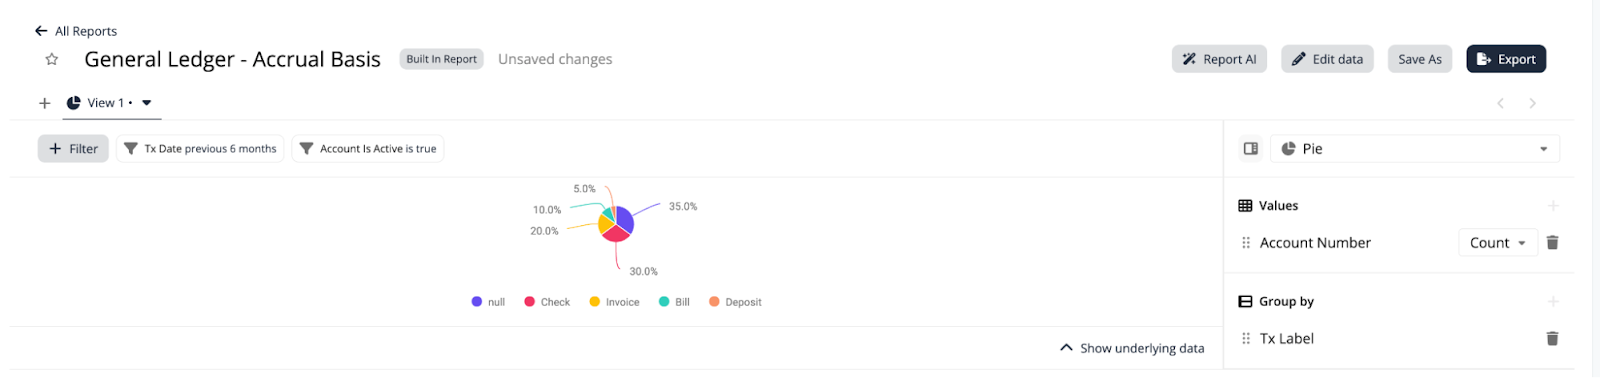
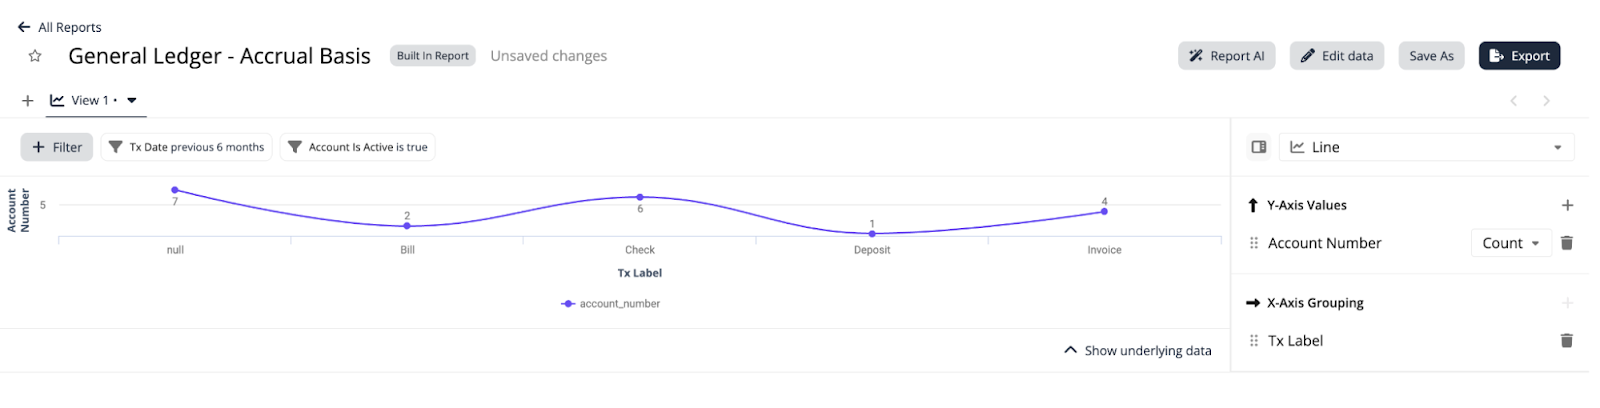
- Display your data in a table, pie chart, line graph, or bar graph
- Present different views of your data in separate tabs on your reports
- Rename your reports
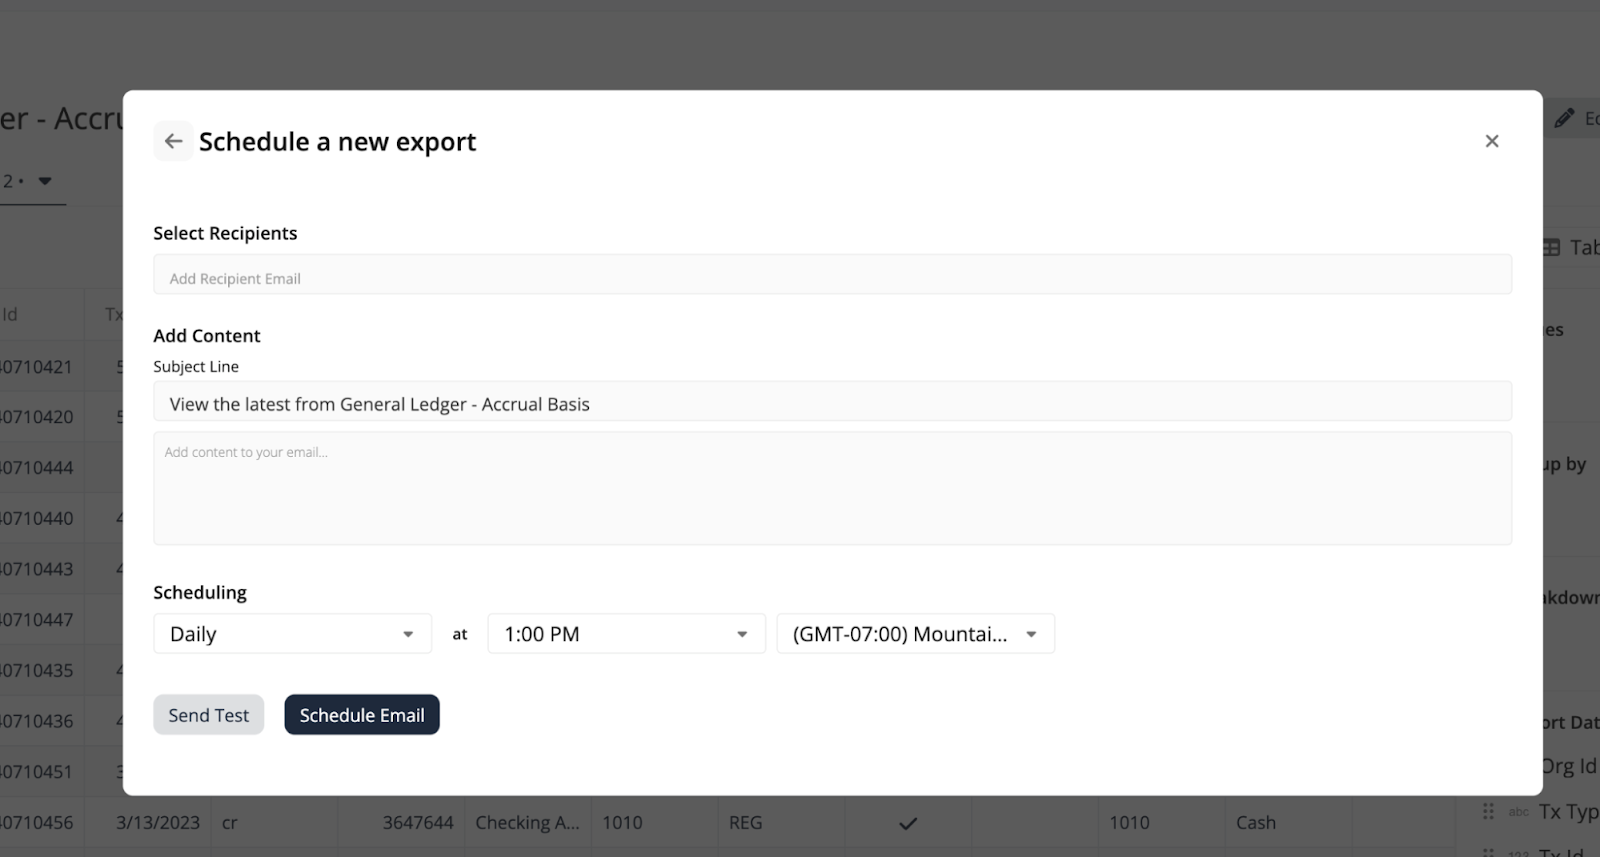
- Set up automated emails of your reports
Enabling Customer Report Builder in Aplos
Aplos Core is required to enable the Custom Report Builder.
The Custom Report Builder is an add-on feature to your subscription. To enable the feature, navigate to the Subscription page under the Settings section. Select “Change Subscription,” and then add Custom Report Builder. You can also disable Custom Report Builder from this screen.
You must be an Administrator of your Aplos account to change the subscription.
If your account is in a contract, you can contact us to get access to the Custom Report Builder.
Don’t have an account yet? Try it free for 15 days.
How Much Does Custom Report Builder Cost?
The Custom Report Builder is $75 per month. This is in addition to your regular Aplos subscription.
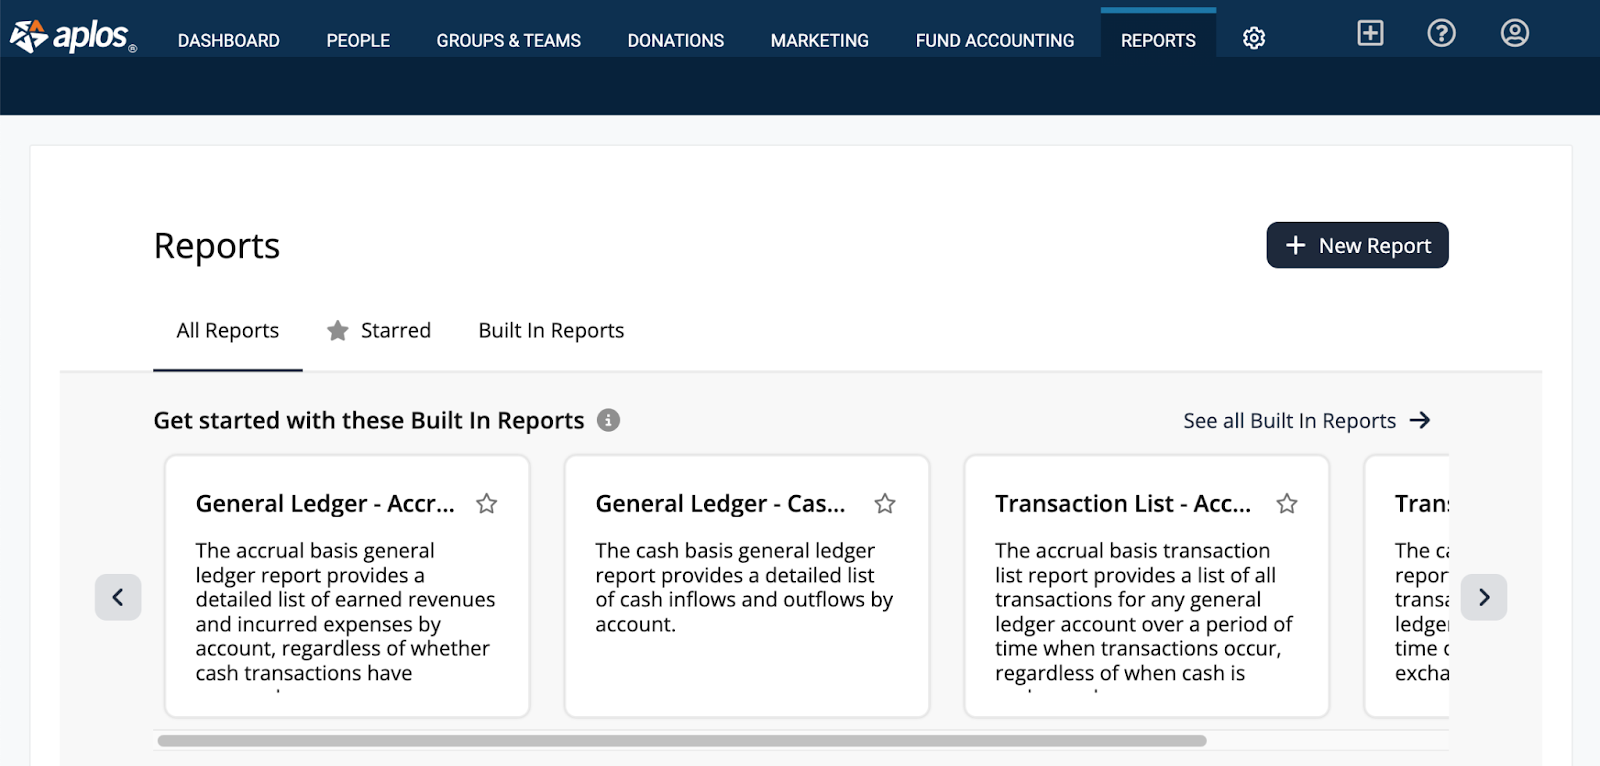
Creating Customized Reports
Start with a built-in report or create a new one from your organization’s raw data.
Financial Templated Reports and Datasets include:
- General Ledger Report
- Transaction List Report
- Transaction List by Tag Report
- Income Data
- Expense Data
- Invoice Data
- Bill Data
Donor and Contact Templated Reports and Datasets include:
- Donations by Contact
- Donations by Household
- Top Donor Report
- Pledges by Contact
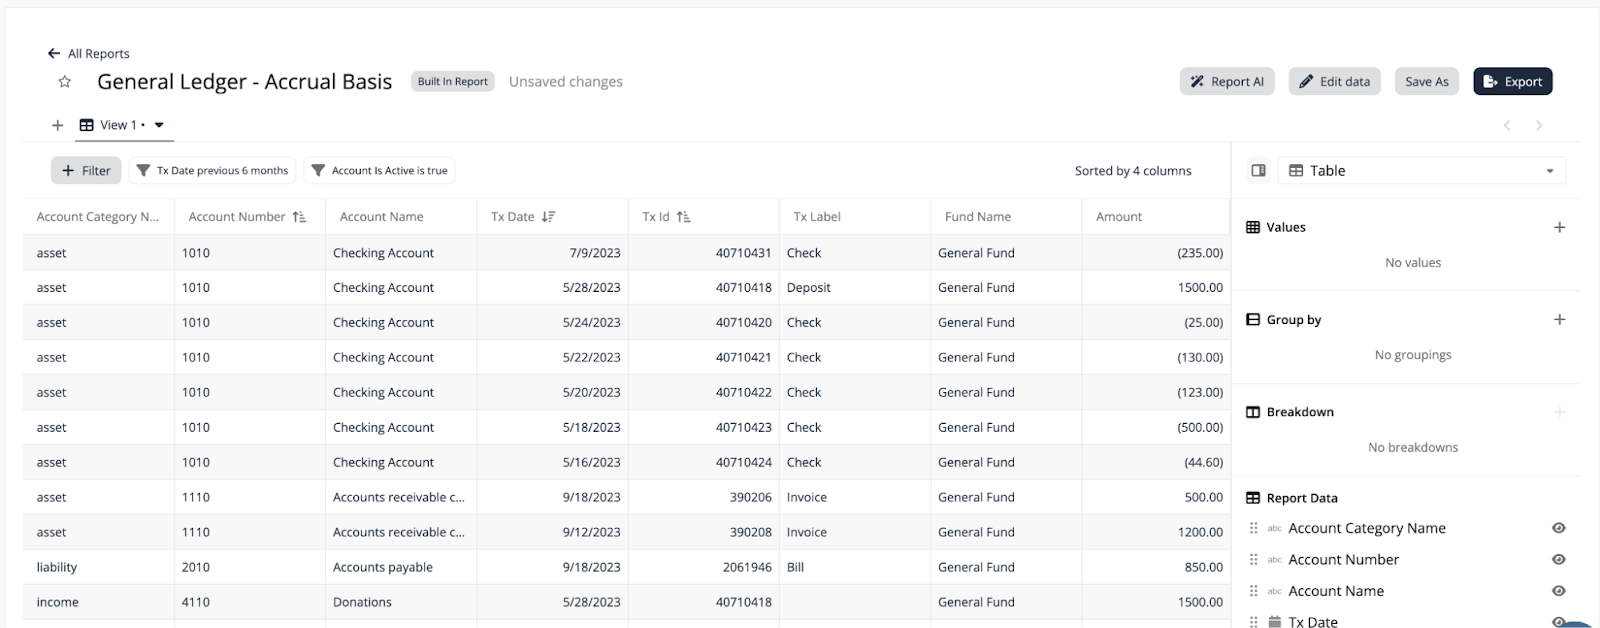
Displaying Data on Your Reports
Drag and drop columns to change the order in which they appear on your report. You can also remove columns you don’t need on your report by hiding them from the report view.
Visualize your data in various ways by creating a line graph, bar graph, pie chart, or table.
Emailing Your Reports
Export your reports to email them directly to the people who need to see them, or set up scheduled emails to automatically send reports. Simply select your recipients, add a subject line and notes about your reports, and schedule your emails to send daily, weekly, or monthly at the time you choose.
For more information about how the Custom Report Builder works in Aplos, check out our resource for how to use Custom Report Builder in Aplos.